National Statistics
Port freight annual statistics: 2018 final figures
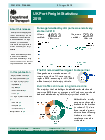
Freight handled by UK ports during 2018.

Documents

Details
Explore our interactive dashboard.
Total tonnage levels for all UK ports remained level in 2018 compared to 2017 at 483.3 million tonnes handled.
For UK major ports in 2018:
- The UK continues to import more than it exports. A total of 252.4 million tonnes were imported, compared to 130.5 million tonnes exported.
- More goods were moved between UK major ports and the EU than any other region in 2018, accounting for 44% (206.2 million tonnes) of total major port traffic.
- liquid bulk goods, which account for 39% of total tonnage, decreased 5% overall; crude oil handled has more than halved since 2000 to 82.4 million tonnes and continues to fall
- unitised traffic fell to 23.9 million units, after five consecutive years growth
- container units increased to a record high of 6.0 million units
- overall roll-on roll-off traffic fell by 1% to 17.9 million units passing through UK major ports.
Please fill in our two-minute user feedback survey, which aims to make Maritime Statistics better, more informative and more user friendly.
Published 21 August 2019